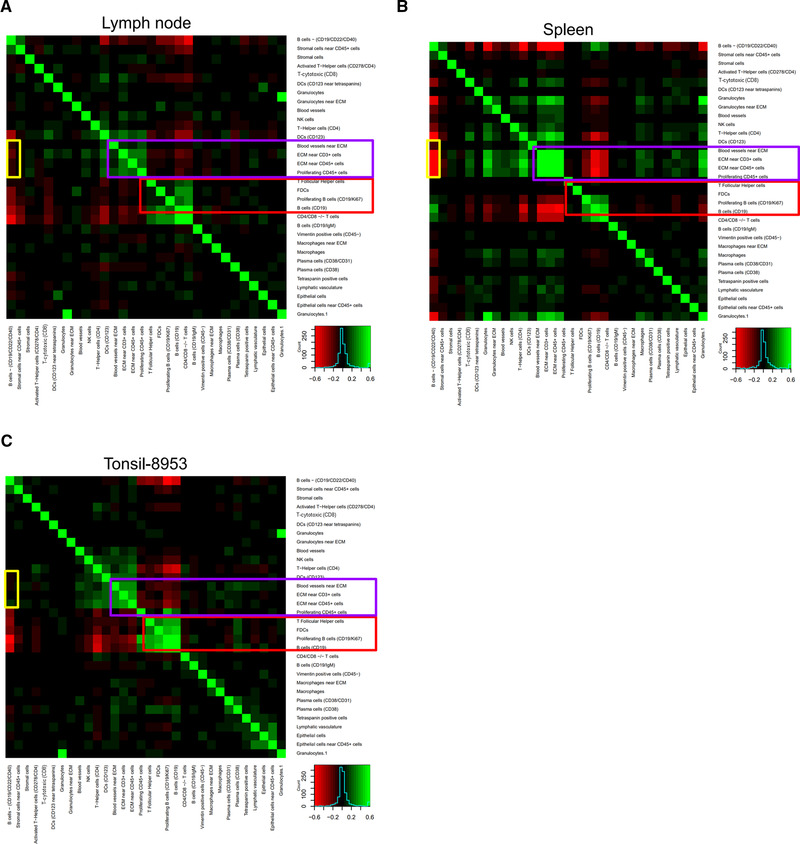
Figure 6.

Cell‐cell density correlation analysis for (A) lymph node, (B) spleen, and (C) tonsil determined by evaluating 100 × 100 pixel regions. The heat map scale is from red (anticorrelated) to green (correlated). Correlated modules present in all three tissues are indicated by purple and red boxes; an anticorrelated module present in spleen but not lymph node or tonsil is indicated by the yellow boxes.
