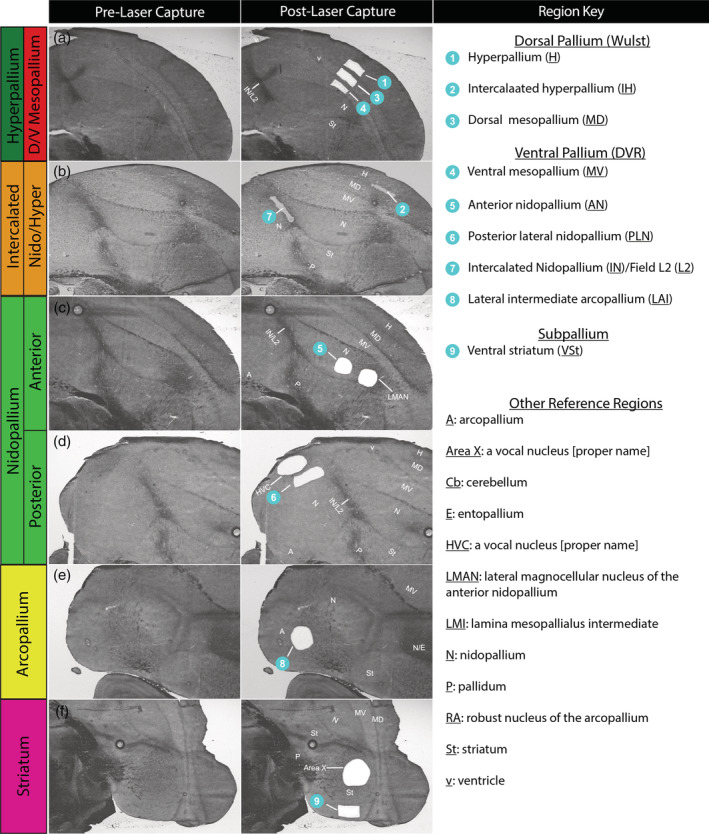
FIGURE 2.

Example images of laser capture microscopy (LCM) dissections. (a–e) Bright‐field sections showing the brain regions profiled before (left column) and after (center column) LCM dissections. Dissected regions are numbered (blue circles). Abbreviations for all relevant brain regions according to the continuum hypothesis (Figure 1(b), Table 1) are provided (right column). Some sections have additional dissections of song nuclei as part of another study in progress. Darker brain regions are due to increased myelination, some of which separate brain subdivisions via axon tracts
