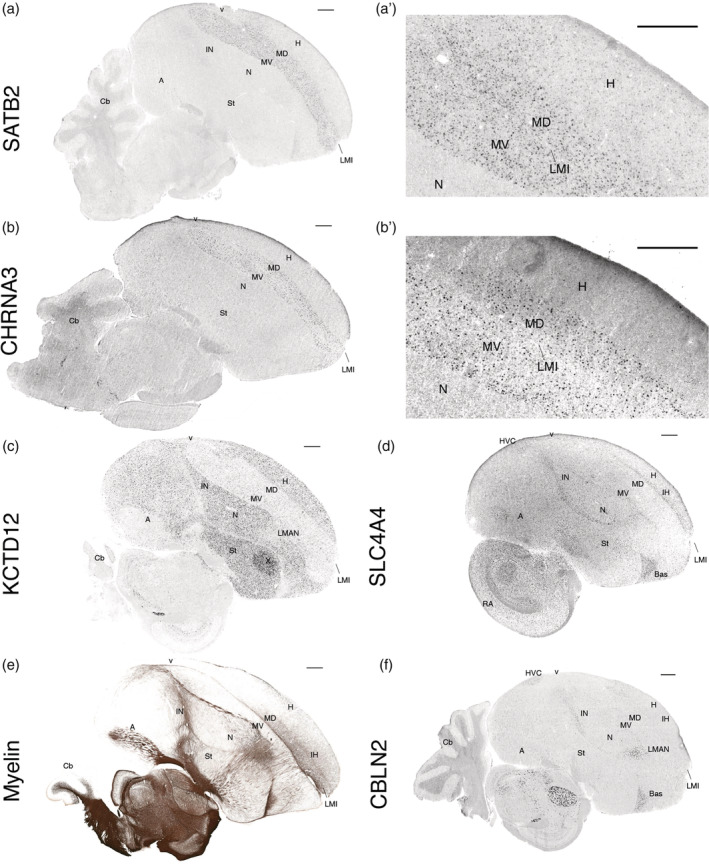
FIGURE 6.

In situ hybridizations and myelin staining confirm RNA‐Seq profiles and reveal full anatomical expression patterns. (a) SATB2, a mesopallium upregulated gene; (a′) higher power image showing that it also has sparse hyperpallium expression, not seen in the nidopallium. (b) CHRNA3, a mesopallium upregulated gene; (b′) higher power image showing that it does not have sparse expression in the hyperpallium. (c) KCTD12, a nidopallium and hyperpallium upregulated gene. (d) SLC4A4, an intercalated pallium upregulated gene. (e) Myelin stain correlating with increased expression of MBP in the anterior dorsal mesopallium (MD) relative to the ventral mesopallium (MV). (f) CBLN2 is upregulated in the intercalated nidopallium but not in the intercalated hyperpallium. All in situ hybridization images are from the Zebra Finch Expression Brain Atlas (Lovell et al., 2020; RRID:SCR_012988) and downloaded as of August 2020. The myelin image is from the digital atlas of the Zebra Finch Brain Architecture Project (Karten et al., 2013; RRID:SCR_004277). All scale bars are 1 mm
