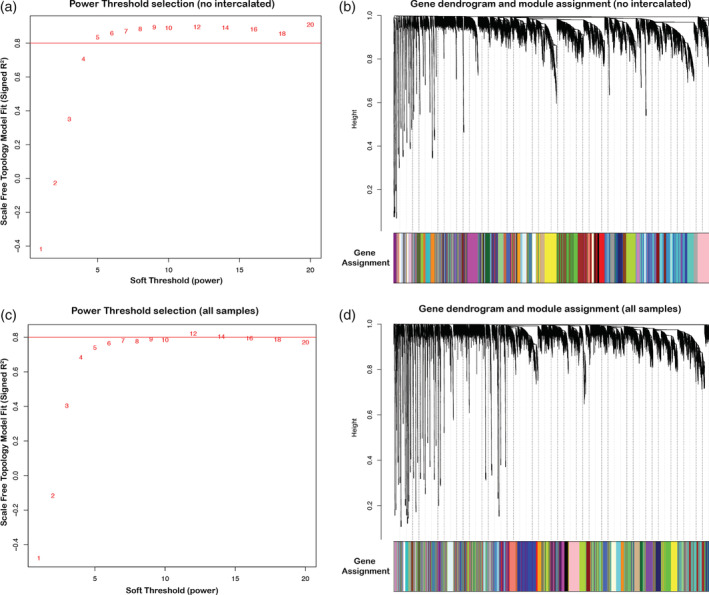
FIGURE 7.

Soft power threshold and gene dendrogram for gene co‐expression networks. (a) For the network excluding the intercalated regions, a soft power (6) was selected to maximize mean connectivity between genes (at least 80%). (b) Gene co‐expression network dendrogram drawn from the soft power threshold in (a), resulting in 47 unique modules (colors). (c) For the network including the intercalated regions, a soft power (8) was selected to maximize mean connectivity between genes (at least 80%). (d) Gene co‐expression network dendrogram drawn from the soft power threshold in (c), resulting in 38 unique modules
