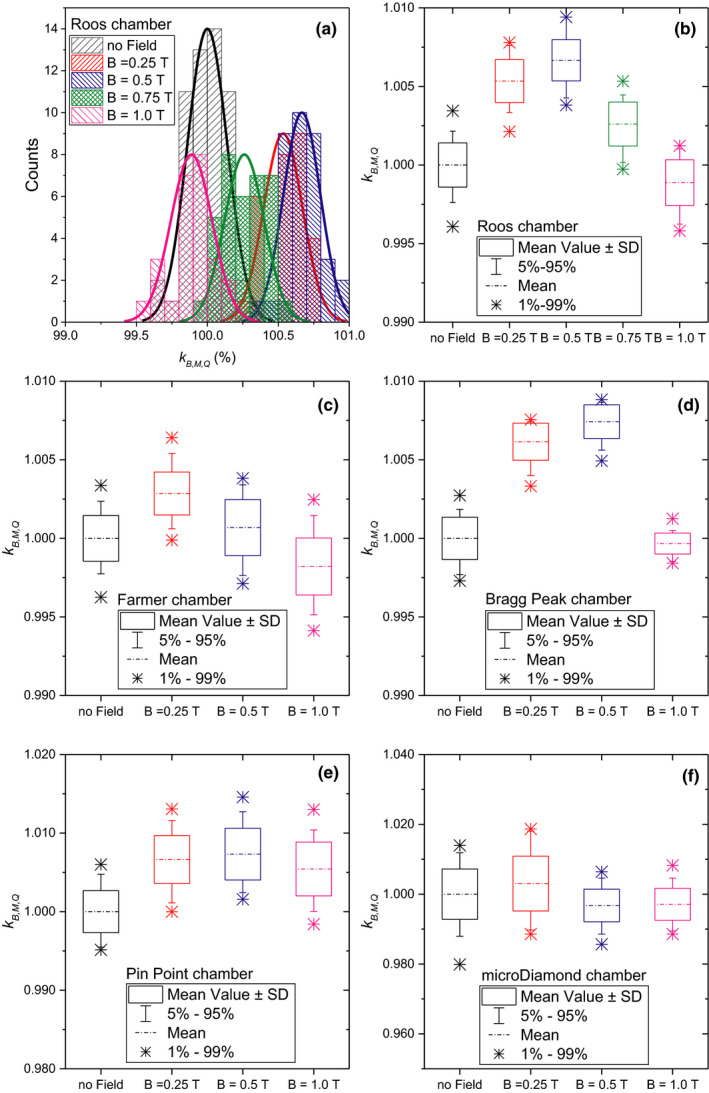
Fig. 4.

Detailed response values per chamber. (a) distribution of the measurement for the Roos electron chamber; box plots for the Roos electron chamber (b), Farmer chamber (c), Bragg peak chamber (d), PinPoint chamber (e), and the microdiamond chamber (f), respectively.
