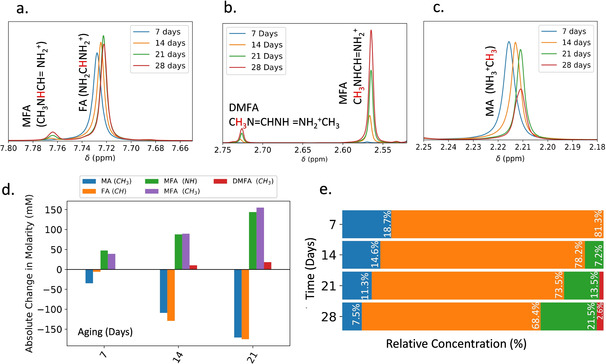
Figure 5.

(a–c) NMR spectra of TC‐mixed solution dissolved in DMF/DMSO measured at several time points over a 1‐month period (full spectra in Figures S15–S18). (d) Absolute change in molarity for the various organic components over time, estimated compared to an internal standard for which the molarity remains constant. (e) Relative concentration of the organic cations over time determined as described in Supporting Information Note 3. Here we see a significant reduction in the relative concentration of both MA and FA, along with an increased concentration of MFA and DMFA.
