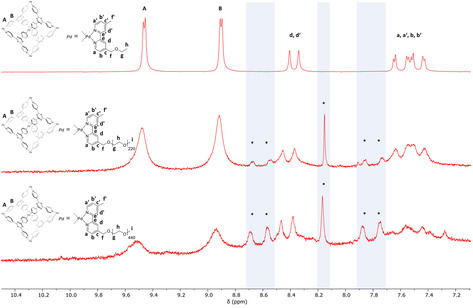
Figure 4.

1H NMR (D2O, 298 K) of 2, 1 a, and 1 b (from top to bottom), after 1 h of total sonication “on” time. The asterisks indicate the cage fragmentation. Only the aromatic region showing panels and bipyridine ligands is shown because of the intense and very broad resonances of the PEG chains.
