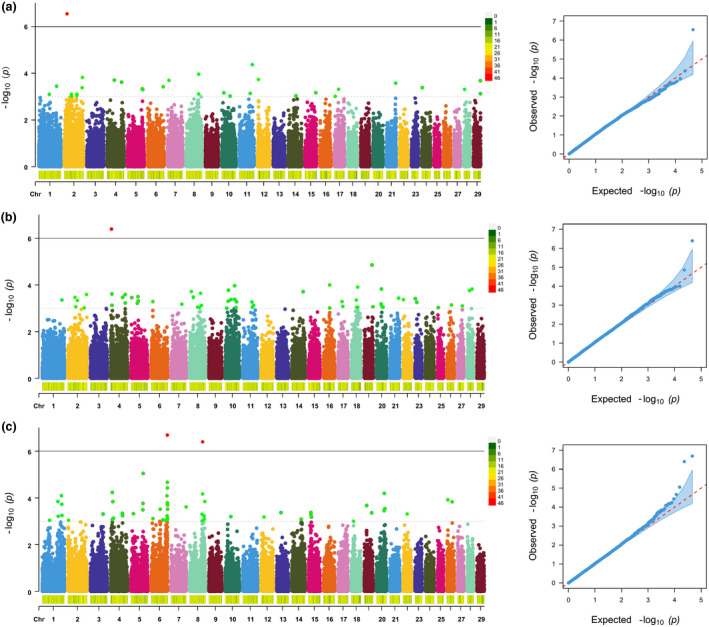
Figure 1.

Manhattan plots and quantile–quantile (Q‐Q) plots of fleece traits for Inner Mongolia Cashmere goats. Black and grey lines indicate the thresholds for genome‐wide significance levels and chromosome‐wide significance levels respectively. The Q‐Q plots show the observed vs expected log P‐values. (a) Fiber length; (b) fiber diameter; (c) cashmere yield.
