
Figure 3.
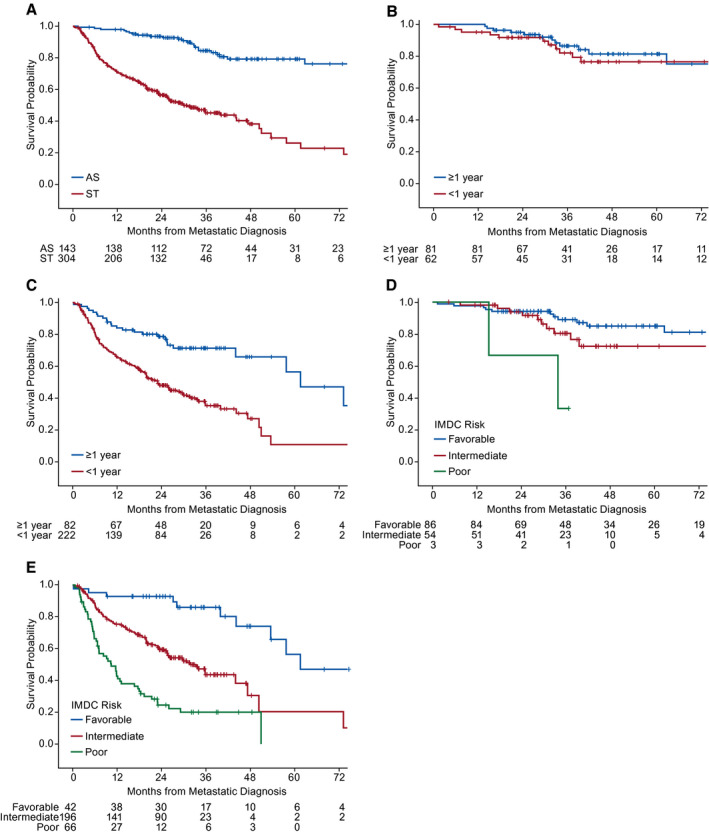
Kaplan‐Meier curves illustrate overall survival in (A) the active surveillance (AS) versus systemic therapy (ST) cohorts, (B) the AS cohort according to the time from initial diagnosis to metastatic diagnosis <1 year versus ≥1 year, (C) the ST cohort according to the time from initial diagnosis to metastatic diagnosis <1 year versus ≥1 year, (D) the AS cohort comparing those with International Metastatic Renal Cell Database Consortium (IMDC) favorable‐risk versus intermediate‐risk versus poor‐risk scores, and (E) the ST cohort comparing those with IMDC favorable‐risk versus intermediate‐risk versus poor‐risk scores.