
Figure 9.
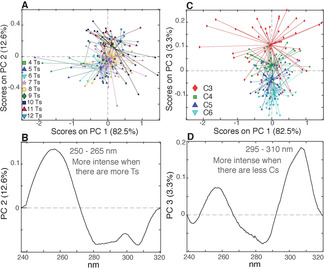
A) PC1/PC2 score plot of the PCA model calculated using the 180 TDS acquired at pH 5.0, colored according to the total number of Ts; B) PC2 loading plot. C) PC1/PC3 score plot colored according to the C‐tract length; D) PC3 loading plot.
Official websites use .gov
A
.gov website belongs to an official
government organization in the United States.
Secure .gov websites use HTTPS
A lock (
) or https:// means you've safely
connected to the .gov website. Share sensitive
information only on official, secure websites.
A) PC1/PC2 score plot of the PCA model calculated using the 180 TDS acquired at pH 5.0, colored according to the total number of Ts; B) PC2 loading plot. C) PC1/PC3 score plot colored according to the C‐tract length; D) PC3 loading plot.