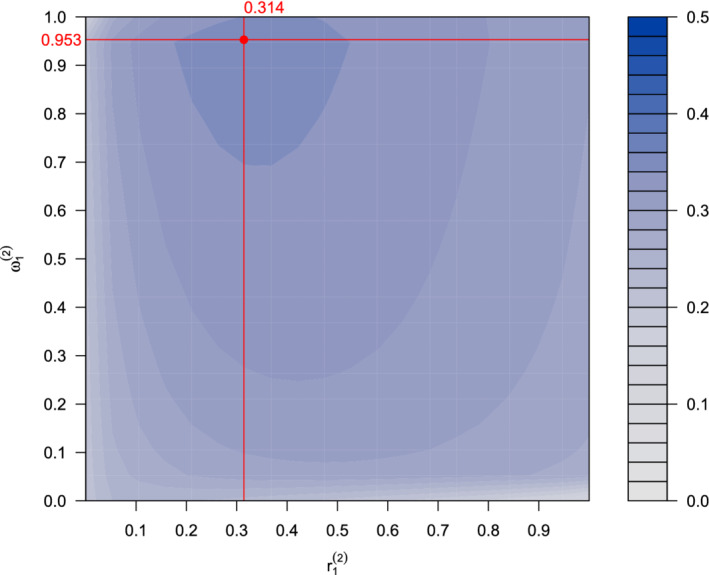
FIGURE 7.

Interim optimization. The color indicates the expected utility given interim data for each combination of second‐stage prevalence for subgroup 1 and testing weight given the interim data [Colour figure can be viewed at wileyonlinelibrary.com]
