Figure 3.

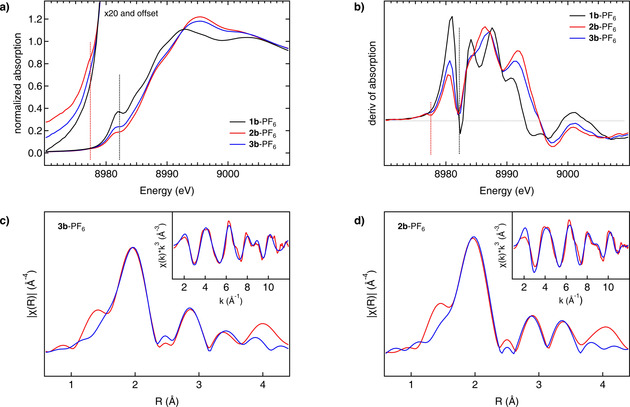
Gaining electronic and structural insights into the reaction of the CuI precursors with O2. a) Cu K‐edge XANES spectra of the precursor 1 b‐PF6 before (black line, CuI) and after the reaction with dioxygen at 183 K (blue line, Cu4O2) and 238 K (red line, Cu2O) with enlarged pre‐edge region. b) Derivatives of the spectra given in (a), showing the XANES region in more detail (see text). c) Phase‐corrected Cu K‐edge Fourier transform of EXAFS of 3 b‐PF6 at 183 K (red). Inset: k 3‐weighted Cu K‐edge EXAFS of 3 b‐PF6 (red). The best fit for both spectra is shown in blue. d) Phase‐corrected Cu K‐edge Fourier transform of EXAFS of 2 b‐PF6 at 238 K (red). Inset: k 3‐weighted Cu K‐edge EXAFS of 2 b‐PF6 (red). The best fit (blue) is obtained by using the theoretical model with two acetone ligands coordinating with their carbonyl O‐atoms (O)s.
