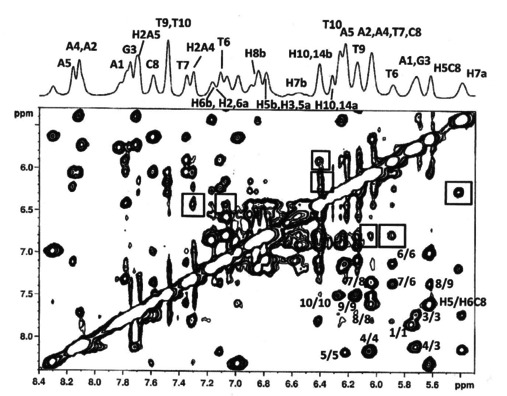
Figure 3.

Selected region of 2D‐NOESY spectrum of ds10 duplex treated with (±)‐trans‐δ‐viniferin at 15 °C in H2O/D2O (9 : 1), 100 mM NaCl, 10 mM sodium phosphate buffer (pH 7.0), at R=[(±)‐trans‐δ‐viniferin]/[DNA]=2.0. The numbers indicate intra‐ and inter‐residue NOE interactions. The boxes indicate the NOE contacts between the ligand and ds10 duplex (see Table 2).
