Figure 3.

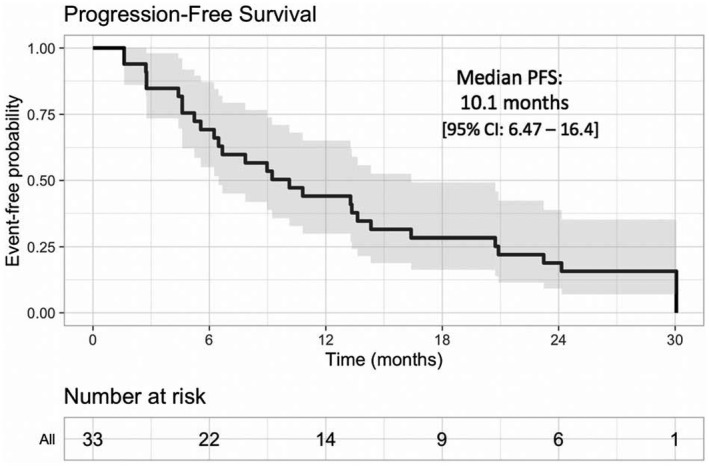
Kaplan‐Meier analysis of PFS. The median PFS (along with the 95% CI) is plotted for all treated patients (isatuximab plus carfilzomib). CI indicates confidence interval; PFS, progression‐free survival.

Kaplan‐Meier analysis of PFS. The median PFS (along with the 95% CI) is plotted for all treated patients (isatuximab plus carfilzomib). CI indicates confidence interval; PFS, progression‐free survival.