Figure 1.

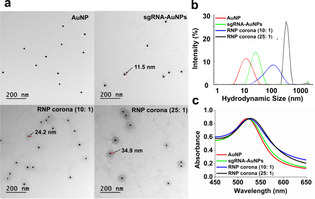
Characterization of AuNPs, sgRNA‐AuNPs, and the binding‐mediated RNP coronae (10:1) and (25:1). a) TEM images. Scale bar=200 nm. b) DLS measurement of hydrodynamic size distribution. c) UV/Vis absorption spectra.

Characterization of AuNPs, sgRNA‐AuNPs, and the binding‐mediated RNP coronae (10:1) and (25:1). a) TEM images. Scale bar=200 nm. b) DLS measurement of hydrodynamic size distribution. c) UV/Vis absorption spectra.