Figure 1.

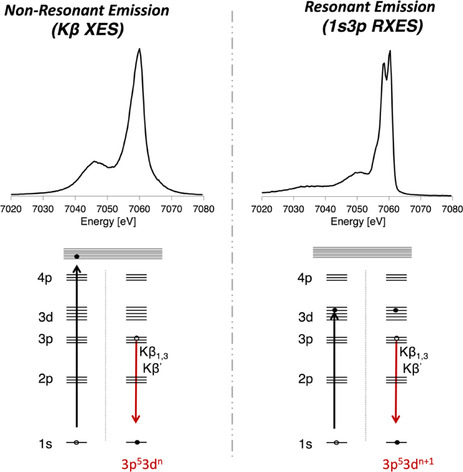
Comparison of the Kβ XES (top left) and 1s3p RXES spectra (top right) for [FeIICl4]2−, with the corresponding excitation and decay processes shown below each spectrum.

Comparison of the Kβ XES (top left) and 1s3p RXES spectra (top right) for [FeIICl4]2−, with the corresponding excitation and decay processes shown below each spectrum.