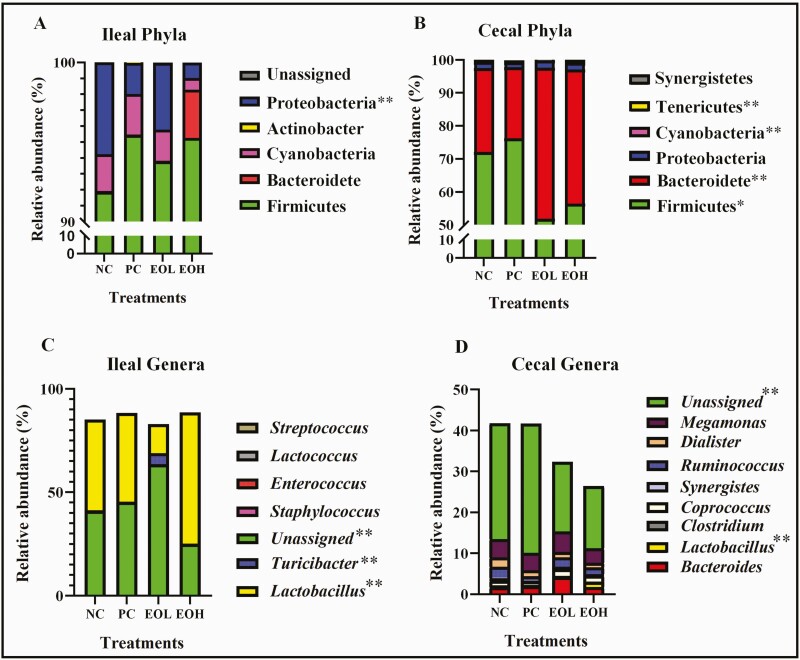
Figure 3.
Relative abundance of ileal phyla (A) and major (>1% relative abundance) genera (C) and cecal phyla (B) and major (>1% relative abundance) genera (D) in birds treated with 30 mg/kg avilamycin or encapsulated cinnamaldehyde. NC, negative control, birds fed with basal diet; PC, positive control, birds fed with 30 mg/kg avilamycin premix; EOL, birds fed 50 mg/kg encapsulated cinnamaldehyde; EOH, birds fed 100 mg/kg encapsulated cinnamaldehyde. Asterisks indicate significant statistically differences (one asterisk means a significance level of 0.05; two asterisks mean a significance level of 0.01).

