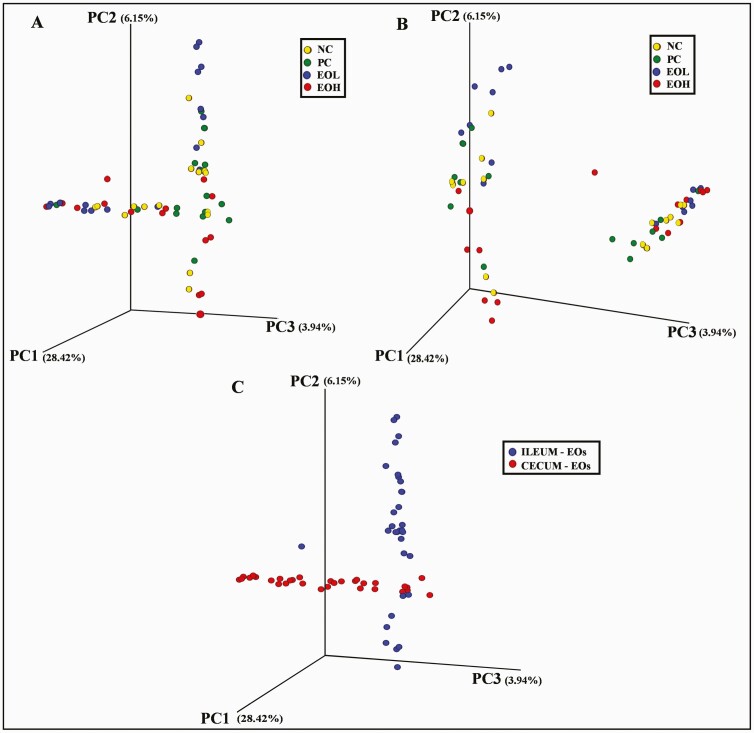
Figure 4.
The 3D principal coordinate analysis (PCoA) graph shows the variation among distance matrixes (weighted UniFrac) of ileal (A) and cecal (B) microbiota alone or together (C) in birds treated with avilamycin premix or encapsulated cinnamaldehyde. Percentages shown are percentages of variation explained by the PC1 (28.42%), PC2 (6.15%), and PC3 (3.94%). NC, negative control, birds fed with basal diet; PC, positive control, birds fed with 30 mg/kg avilamycin premix; EOL, birds fed 50 mg/kg encapsulated cinnamaldehyde; EOH, birds fed 100 mg/kg encapsulated cinnamaldehyde; EOs, essential oils.

