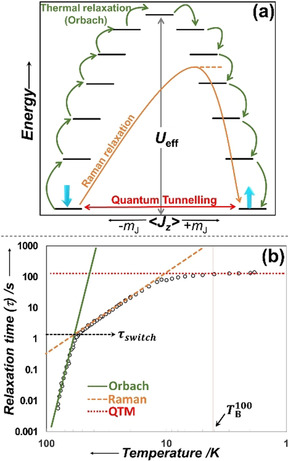
Figure 1.

(a) Schematic of the energy barrier (U eff) and the main relaxation mechanisms. The black lines represent the energies of various magnetic spin states (m J). The spin trapped in one of the bistable m J states relaxes back (crossing the barrier: U eff) to its original state by either stepwise transitions through higher energy m J states (i.e., Orbach process; green arrows), by going through a virtual excited state (Raman; orange arrow) or by quantum tunnelling of magnetisation (QTM; red arrow) from the ground state. (b) Relaxation profile (τ vs. T −1) of an SMM showing the different temperature regions where one relaxation process dominates over the others. Orbach (green line) process at higher temperatures, Raman (orange dashed line) in the intermediate range and QTM (red dotted line) in the low temperature region. The black circles represent the observed/measured τ value against temperature. τswitch is the relaxation time at which the Raman process and the Orbach process have the same relaxation rate. is the temperature at which τ values are over 100 s.
