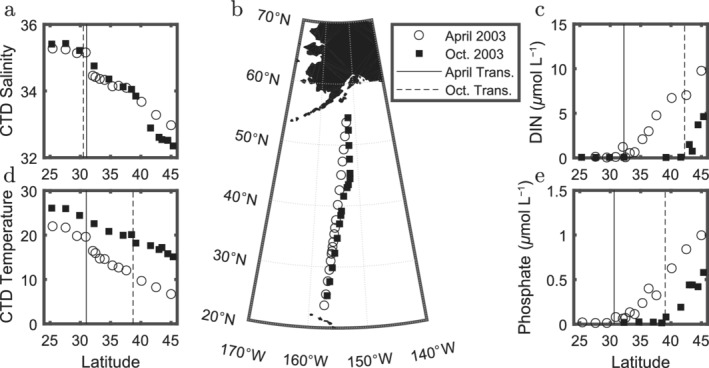
Fig 1.

Static and moving transitions are seen in observations from two cruises, panel (b), between Hawaii and Alaska (Church et al. 2008) in 2003, open circles for April and black squares for October. Shown against latitude are surface (a) salinity (psu); (c) DIN (μmol L−1); (d) temperature (°C) and (e) phosphate (μmol L−1). Solid vertical lines indicate the location of the transition in each field for October and dashed for April. Transitions are defined by the maximum in the latitudinal derivative for the field (for salinity, temperature) or the logarithm of the field (for DIN and phosphate). Data can be found at https://hahana.soest.hawaii.edu/cookbook/cookbook.html.
