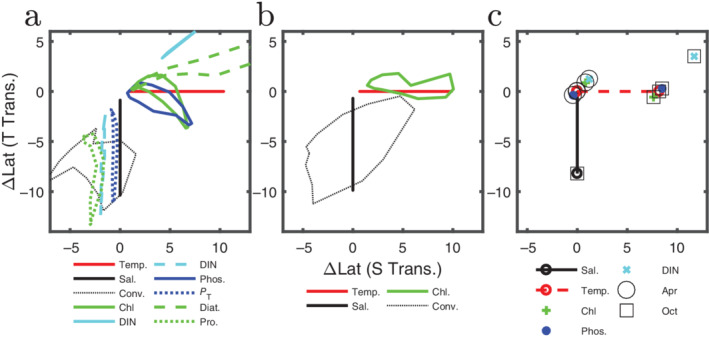
Fig 5.

The location of each transition is plotted relative to the more static (southern) salinity transition (black line in Fig. 4) and the more seasonally varying location of the temperature transition (red lines in Fig. 4). Relative location is calculated for each month as the number of degrees of latitude between the transition of interest (e.g., Chl) and the (southern) salinity transition (horizontal axis, ΔLat [S transition]) and from the temperature transition (vertical axis, ΔLat [T transition]). These differences are plotted for each month, giving an indication of the trajectory of the seasonal cycle in this phase space. Some transitions are more static (shape of trajectory is more vertical) or more seasonally varying in location (more horizontal), but many have both components (more circular). (c) Cruise data (Church et al. 2008) plotted similar to panels (a) and (b). Circles are for the April 2003 cruise, and squares for the October 2003 cruise. Black: salinity; red: temperature; green: Chl a; dark blue: phosphate; light blue: nitrite + nitrate.
