Fig 6.

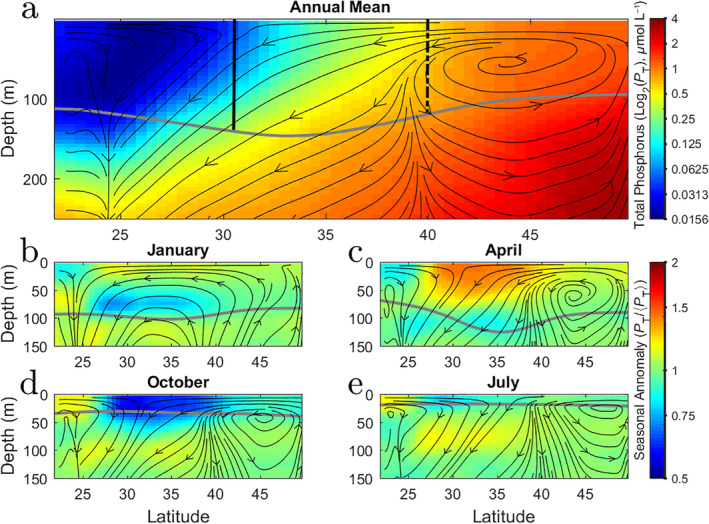
Modeled latitude‐depth transects along 158 W. (a) Shading is the annual mean model total phosphorus concentration (log2 μmol L−1), P T, which includes all inorganic and organic forms of phosphorus. Lines with arrows indicate the streamlines as determine from the vertical and meridional velocities. The gray line indicates the mixed layer depth. Vertical solid black and dashed lines in are the approximate locations of the southern and northern boundaries of the transition zone shown using salinity in Fig. 3. (b–e) Shading is the seasonal anomaly of total phosphorus concentration (unitless) presented as the seasonal mean divided by the annual mean and presented in log space. Positive (redder) indicates higher than annual average and negative (bluer) indicates seasonal average is lower. Arrows and lines as in (a) but for specific months. (b) Janaury (winter), (c) April (spring), (d) October (fall), (e) July (summer).
