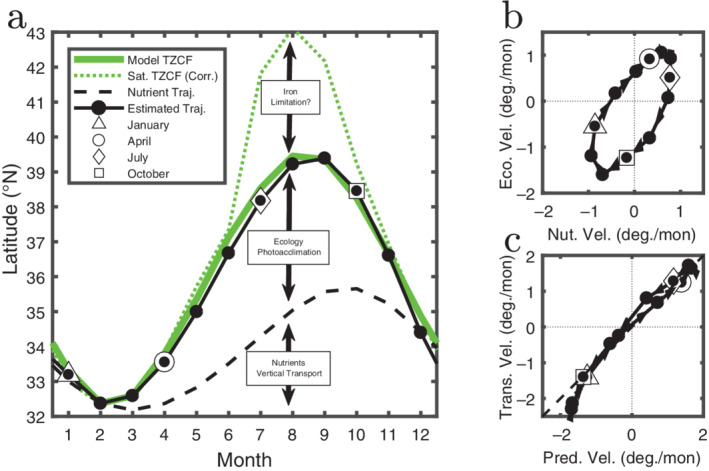
Fig 8.

The seasonal motion of the TZCF along the 158 W transect (see Fig. 2) is compared with predictions. (a) The latitude of the Chl transition for satellite (dotted green line, corrected for the latitudinal shift in the Transition Zone between model and satellite) and model (solid green line) as calculated by the derivative method. The black solid line indicates the transition location as estimated by Eq. 5. Also shown is the nutrient driven component (dashed black line) as determined by the first term on the right‐hand side of Eq. 5. The difference between the two black lines is the ecologically driven component (second term on right hand side of Eq. 5). (b) The speed with which each of the two terms (nutrient vs. ecological) translate northward between each month plotted against one another. Open symbols indicate different months and link to those in panel (a). (c) The speed that the modeled transition moves northward [solid green line in (a)] vs. that estimated via the combination of terms in Eq. 5 [solid black line in (a)]. Dashed line is the one‐to‐one line, which would indicate that the estimated velocity was perfect.
