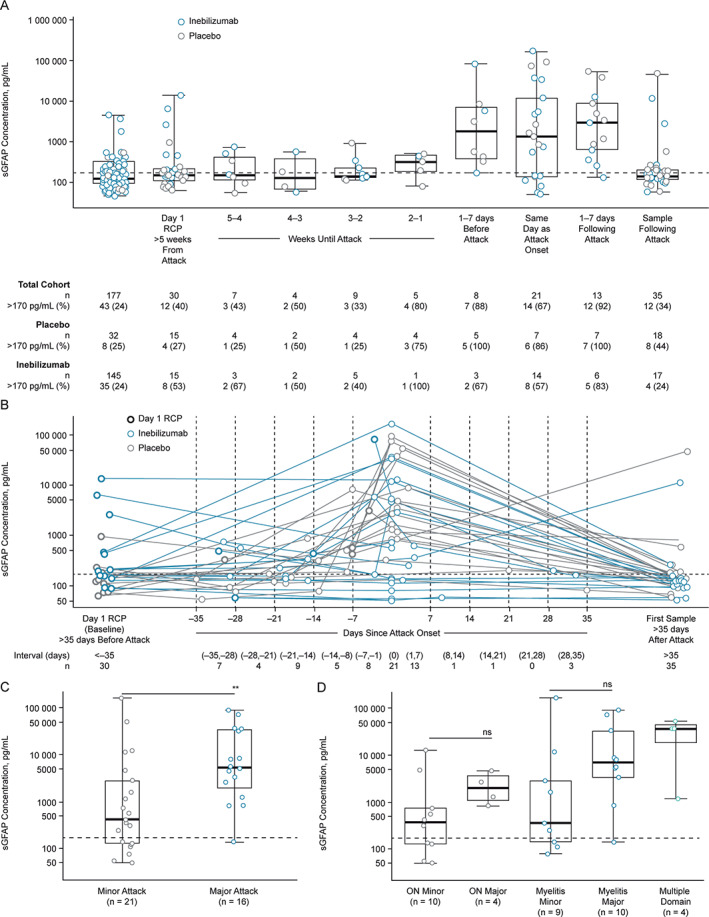
FIGURE 3.

The sGFAP concentration at baseline at visits leading to an adjudicated NMOSD attack, and during attack. (A) Graph shows a boxplot of sGFAP measurements leading up to attack in 38 participants who experienced an adjudicated attack and provided sGFAP measurements. Baseline samples >5 weeks from attack were available in 30 of 38 participants. Eight participants experienced attacks within 5 weeks of the baseline sample collection. (B) Graph shows a profile plot of sGFAP measurements in the days leading up to the attack. Graphs show sGFAP concentration of samples drawn most proximal to attack and within 1 week of adjudicated NMOSD attack by attack severity (C) and organ domain involvement (D), measured by the OSIS. Of the attacks across multiple domains, 4 were minor myelitis attacks, and one sample from myelitis major group displayed sGFAP within the healthy donor range. Box and whiskers represent sample quartiles. Statistical significance between groups was assessed using Mann–Whitney U test. Dashed lines represent 2 SDs from the healthy donor mean (170 pg/ml). NMOSD = neuromyelitis optica spectrum disorder; ON = optic neuritis; OSIS = Opticospinal Impairment Scale; RCP = randomized controlled period; SD = standard deviation; sGFAP = serum glial fibrillary acidic protein.
