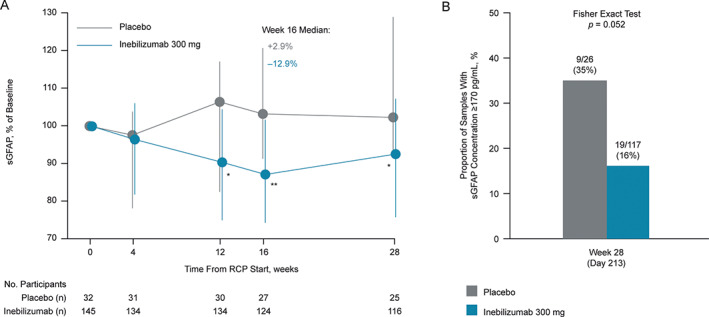
FIGURE 5.

Change in sGFAP concentration from baseline in participants who did not experience an adjudicated NMOSD attack. (A) Graph shows change in sGFAP concentration over time in participants without attacks. Error bars represent interquartile range. Statistical significance of percentage change from baseline, comparing inebilizumab to placebo, was assessed using the Mann–Whitney U test; *p < 0.05; **p < 0.01; ***p < 0.001; week 16 changes from baseline remained significant (adjusted p value < 0.05) between dose groups after the Bonferroni correction was applied to p values. Nineteen of 117 (16%) inebilizumab samples and 9/26 (35%) placebo samples were outside healthy donor range (Fisher's exact test, p = 0.052). (B) Graph shows proportion of participants with elevated sGFAP concentrations (≥170 pg/ml) at week 28 of the RCP in participants receiving placebo or inebilizumab. FC = fold change; NMOSD = neuromyelitis optica spectrum disorder; RCP = randomized controlled period; sGFAP = serum glial fibrillary acidic protein.
