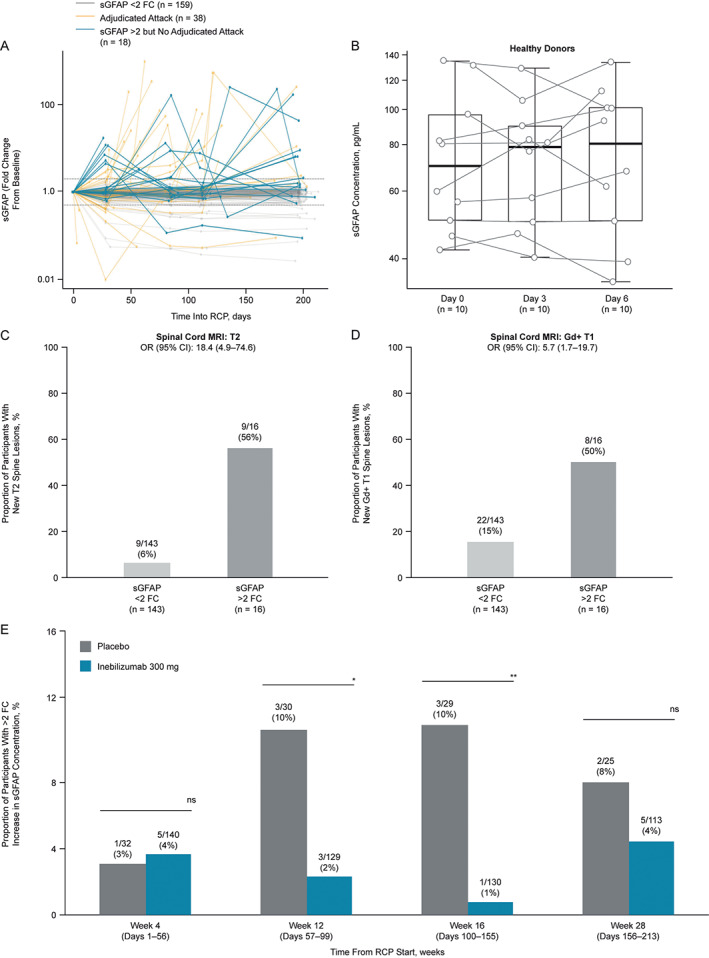
FIGURE 6.

The sGFAP increases in participants without adjudicated attacks are correlated with disease activity. (A) Profile plot of longitudinal fold change from baseline in sGFAP concentration in participants with NMOSD who experienced adjudicated attacks (gold), those who did not experience adjudicated attacks but displayed an increase greater than twofold from baseline (blue), and in those who neither experienced attacks nor displayed increases greater than twofold from baseline (gray) in sGFAP during the RCP. (B) Boxplots displaying sGFAP concentrations observed in 10 healthy controls across 3 blood draws. Proportion of (C) new spinal cord T2 or (D) Gd‐enhancing T1 lesions observed in participants who did not experience committee‐adjudicated attacks and had MRI scans, but either did or did not display a greater than twofold increase in sGFAP during the RCP. (E) Bar chart shows proportion of participants with an increase greater than twofold in sGFAP from baseline. The total number of participants at each time point represent those remaining in the RCP with available sGFAP data. Statistical significance in the between‐group difference was assessed using the Cochran–Armitage test, *p < 0.05; **p < 0.01; ***p < 0.001, week 16 changes from baseline remained significant (adjusted p value < 0.05) after the Bonferroni correction was applied to p values. AC = adjudication committee; CI = confidence interval; FC = fold change; Gd = gadolinium; MRI = magnetic resonance imaging; NMOSD = neuromyelitis optica spectrum disorder; OR = odds ratio; RCP = randomized controlled period; sGFAP = serum glial fibrillary acidic protein.
