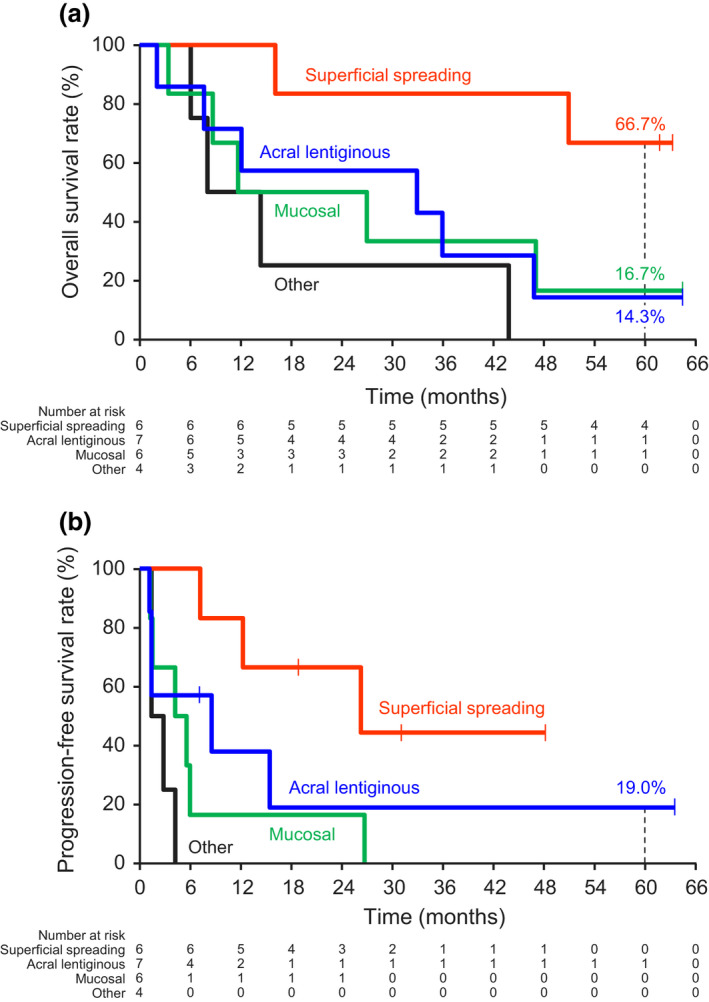
FIGURE 3.

Kaplan–Meier curves of (a) overall survival in subgroups and of (b) progression‐free survival (central assessment) in subgroups by melanoma type

Kaplan–Meier curves of (a) overall survival in subgroups and of (b) progression‐free survival (central assessment) in subgroups by melanoma type