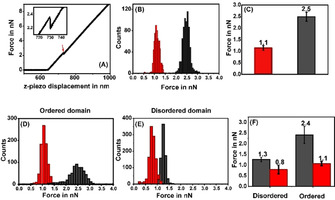
Figure 1.

Probing the stiffness of membrane lipid bilayers by AFM force indentation measurements. (A) A typical indentation force curve obtained from supported POPC/POPG/cholesterol (1:1:1) lipid bilayer on mica. The force applied by the cantilever is plotted as a function of the z‐piezo displacement. The discontinuity in the force curve marks the point of indentation (red arrow). Inset: magnified image shows an indentation force of 2.2 nn. (B) Representative histogram of indentation forces before (black) and after (red) serotonin incubation on a negatively charged (PPC111) bilayer. (C) Average values of force histograms. (D), (E) representative histograms of indentation forces measured on the ordered and disordered domains, respectively on a neutral biphasic (DEC221) bilayer. (F) Average values of force histograms before (black) and after (red) serotonin incubation.
