
Figure 3.
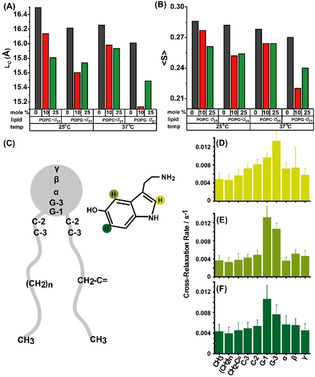
Probing the distribution and the effect of serotonin in lipid bilayer by solid‐state NMR. (A) Average lipid chain length of POPC‐d 31: POPG:cholesterol (1:1:1) and POPC:POPG‐d 31:cholesterol (1:1:1) with 0, 10, 25 mol % of serotonin at (i) 25 °C and (ii) 37 °C. (B) 2H NMR average order parameters of the above mentioned membrane composition. (C) schematic representation of serotonin interaction with POPC lipid chain segment. (D,E,F) are the 1H NOESY NMR cross‐relaxation rates representing the contact probability between the individual protons of serotonin labelled in (C) with the respective lipid segments.