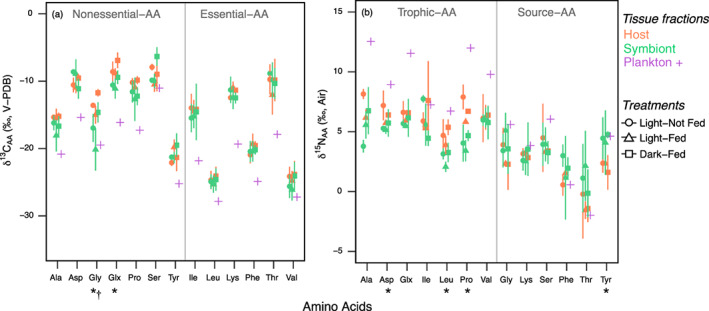
Fig. 3.

(a) δ13C and (b) δ15N values of individual amino acids in coral host, Symbiodiniaceae symbionts, in response to nutrition treatments relative to a pooled plankton sample. Treatments are Light–Not Fed (L–NF), Light–Fed (L–F), Dark–Fed (D–F); values are mean ± SD (n = 2), except for the plankton sample (n = 1). X‐axis symbols indicate significant differences (p < 0.05) between fractions (host and symbiont, *) and treatments (†).
