
Fig. 4.
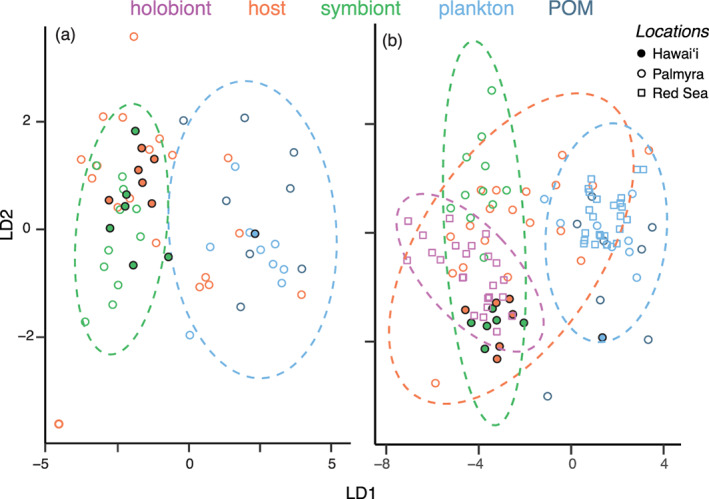
Linear discriminant analysis of mean‐normalized amino acid carbon isotope fingerprints using (a) six essential amino acids (isoleucine, leucine, lysine, phenylalanine, threonine, tyrosine, valine) and (b) five essential amino acids (without lysine). Ellipses represent 95% confidence ellipses for each nutrition group (autotrophy [symbiont] or heterotrophy [plankton‐POM]). In (a) and (b), Hawai'i data are host and symbiont (n = 6 [fragments from two reef genets in three experimental treatments]) and plankton (n = 1 [63–250 μm]); Palmyra data are host (n = 19), symbionts (n = 11) (from 19 colonies [10 m]) and plankton (n = 9 [>163 μm]) and POM (n = 8 [>0.7 μm]) at four sites (Fox et al. 2019). Red Sea data in (b) are host+symbiont (holobionts, n = 23 colonies) and plankton (n = 23 [>333 μm]) from eight sites (McMahon et al. 2015).