
Figure 3.
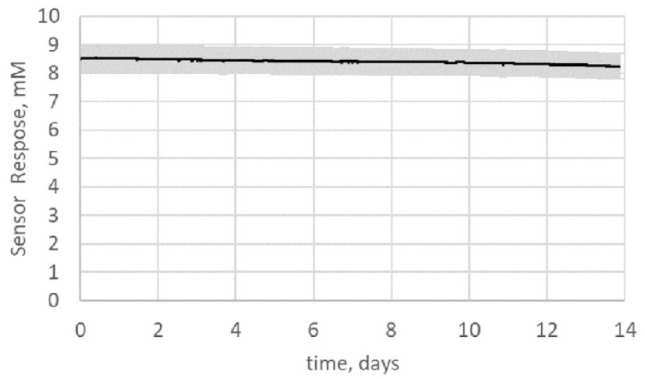
Change in sensor response (solid line is the mean and shaded area is 1 standard deviation of the data from 16 sensors) at 8 mM ketone held at 37°C for 14 days.
Official websites use .gov
A
.gov website belongs to an official
government organization in the United States.
Secure .gov websites use HTTPS
A lock (
) or https:// means you've safely
connected to the .gov website. Share sensitive
information only on official, secure websites.
Change in sensor response (solid line is the mean and shaded area is 1 standard deviation of the data from 16 sensors) at 8 mM ketone held at 37°C for 14 days.