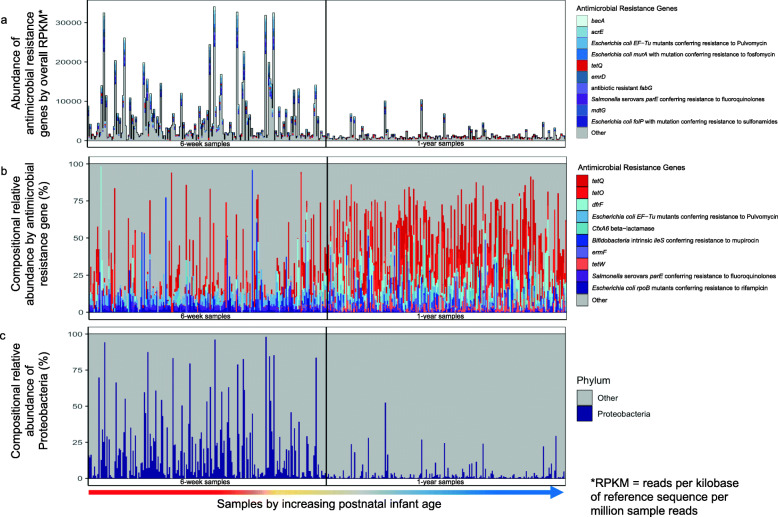
Fig. 1.
Composition of the resistome and microbiome in 420 infant gut samples. All samples are ordered by increasing sample age at collection and the black vertical lines demarcate the 6-week samples from the 1-year samples. (a) Overall relative abundance (in RPKM) of the 10 antimicrobial resistance genes with the greatest mean abundance across all samples. (b) Compositional relative abundance of the 10 antimicrobial resistance genes with the greatest mean compositional abundance across all samples. (c) Compositional relative abundance of Proteobacteria. For (a) and (b), antimicrobial resistance genes are colored red if they are tet genes and blue or purple otherwise

