Fig. 2.
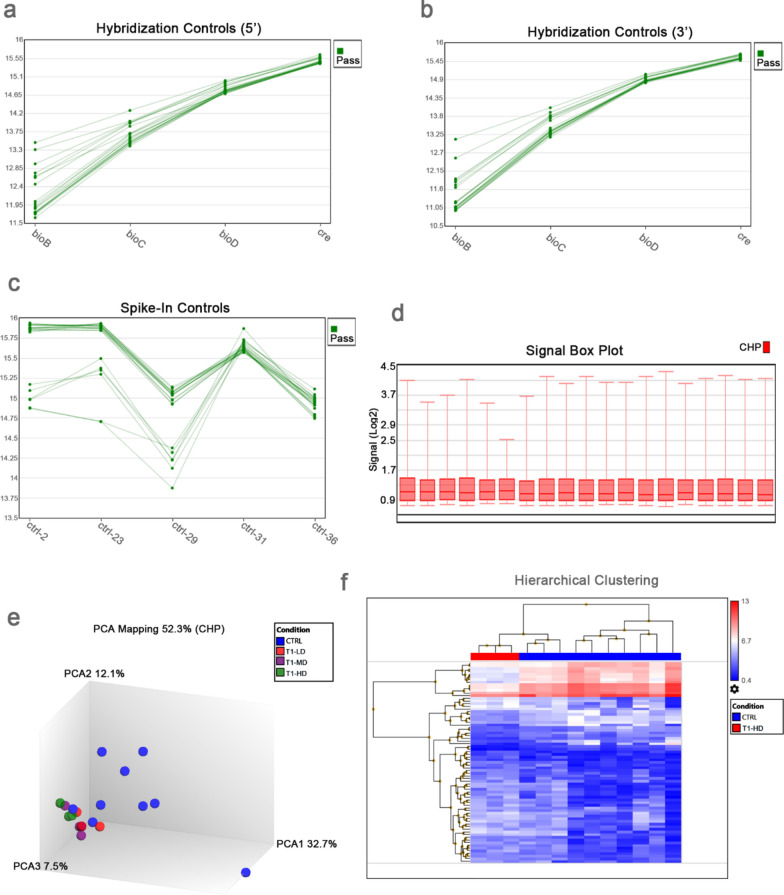
Quality control of miRNA data. Affymetrix microarrays were subjected to quality control criteria specified in Transcriptome Analysis Console (TAC 4.0), i.e. (a, b) 5’ and 3’ hybridization controls, (c) spike-in controls and d signal box plot. e Principal component analysis (PCA) mapping of the miRNA data, showing majority of untreated control samples in one group and treated samples in another group. f Hierarchical clustering of filtered genes (Fold Change < −2 or > 2, P-Value < 0.05, 75 miRNAs, listed in Additional file 5: Table S4) in samples treated with T1-HD vs. untreated control. T1 = Methyl acrylate (CAS 96–33-3), LD = 0.1 mM, MD = 0.3 mM, HD = 1 mM

