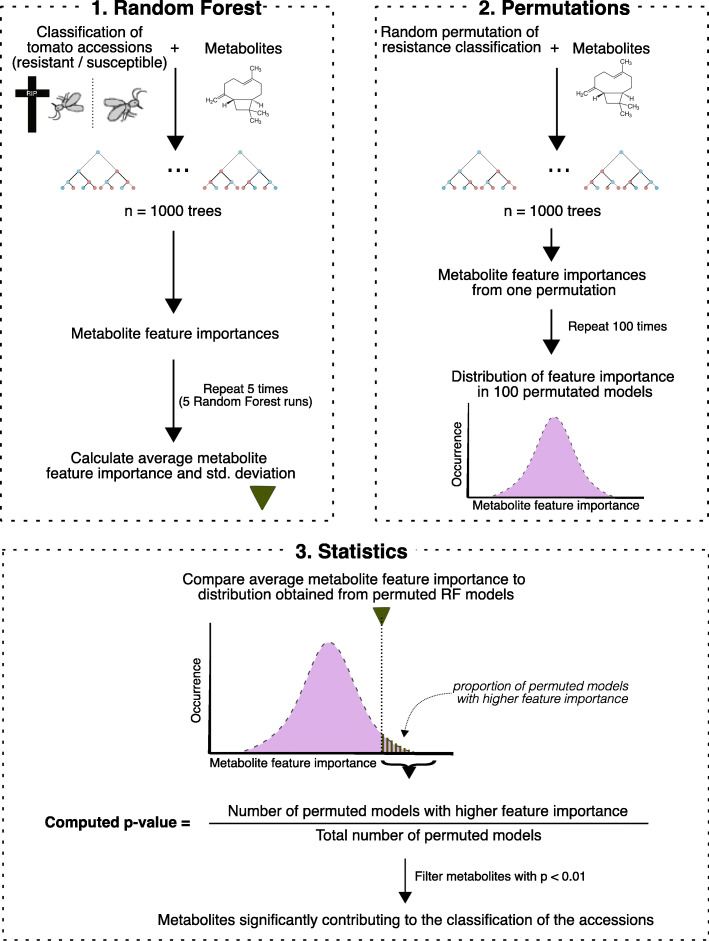
Fig. 4.
A schematic overview of the random forest analysis and metabolite selection procedure. First, (1) the RF algorithm was ran using resistant/susceptible labels as sample classifications and the metabolites as classifiers. This generates a feature importance for each metabolite and the average feature importance was calculated over 5 RF models. Next, (2) the sample classifications were randomly permutated over 100, 250 and 500 RF models, creating random feature-importance distributions per metabolite. Finally, (3) for each metabolite, the average feature importance calculated in (1) was compared to the distributions of (2) and p-values were calculated. Metabolites having an average feature importance significantly higher than their permuted models (p < 0.01) were predicted to contribute significantly to the resistant/susceptible classification of the accessions

