Fig. 1.

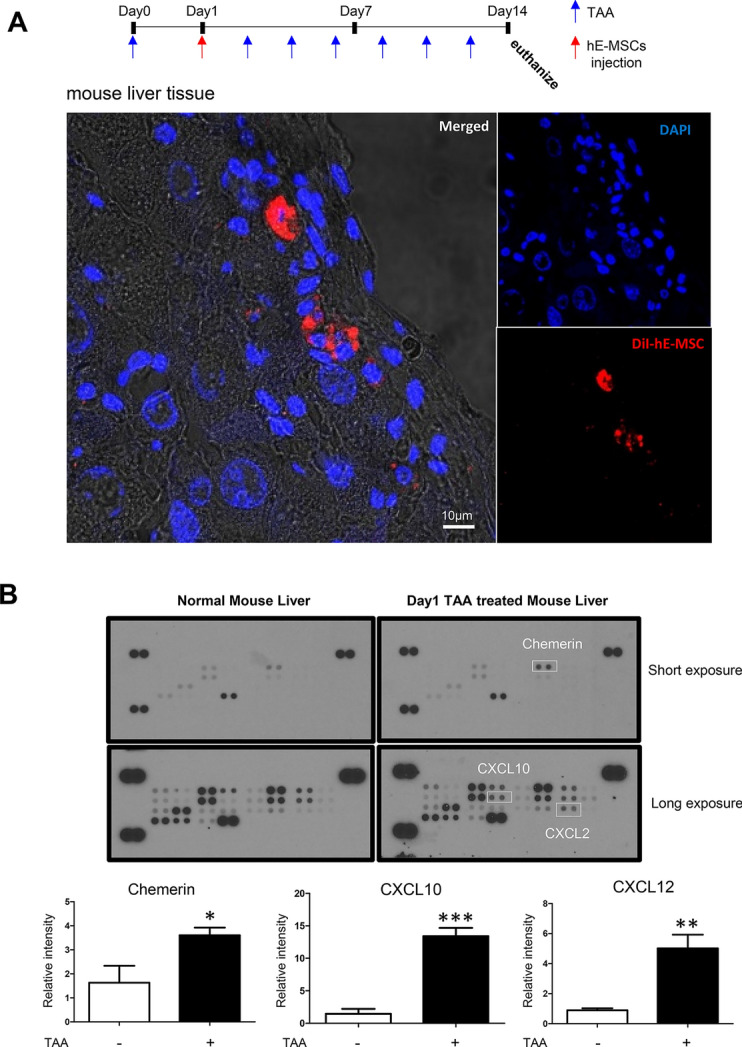
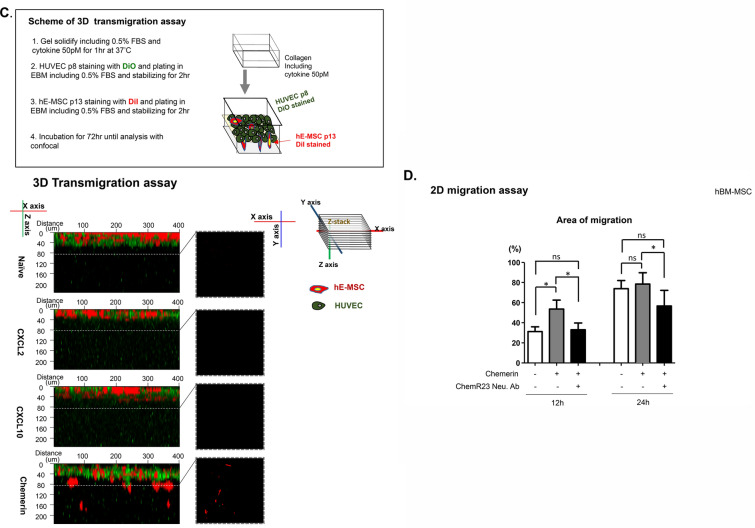
Screening of chemoattractant candidates for hMSCs. A Liver fibrosis model was generated by injecting TAA (0.2 mg/mL) every 2 days to the mouse. DiI-labeled hE-MSCs were systemically administered after the first TAA injection. DiI-labeled hE-MSCs were found in mouse liver treated with TAA. DiI hE-MSCs are red and the nuclei are blue. B Mouse chemokine array blots of normal and the injured liver at 1-day after TAA-treatment. The upper blot was exposed for 5 min and the bottom blot was exposed for 10 min. Chemokines are shown as duplicate dots. Reference dots are shown at the periphery; top right and left as well as bottom left. White squares indicate chemokines that were significantly increased in the injured mouse liver with TAA (0.2 mg/mL). The data shown were reproducible results from two independent experiments. Blots were quantified by Image J software. (C) 3D transmigration assay. Upper panel shows the scheme. The 3D transmigration system constructed using DiO-labeled HUVECs (green) as the endothelial layer on the surface of collagen gel below containing a given chemokine such as CXCL2, CXCL10, or chemerin (all at 50 pM). DiI-labeled hE-MSCs (red) were seeded on HUVECs and their migration into collagen gel was observed for 72 h by performing Z-stacking in a confocal microscope. Migration distances of hE-MSCs are indicated on a scale of 40 µm. The data shown are reproducible results from two independent experiments. D 2D random migration assay of hBM-MSC in response to chemerin or ChemR23 blocker (ChemR23 neutralizing antibody). Quantification of cell migration at 12 and 24 h was represented as the percentage of cell coverage in the initial cell-free zone. The white bar represents control hBM-MSCs, the gray bar indicates hBM-MSCs exposed to chemerin in media, and the black bar indicates hBM-MSCs that were treated with the ChemR23 neutralizing antibody in addition to chemerin

