Figure 1.

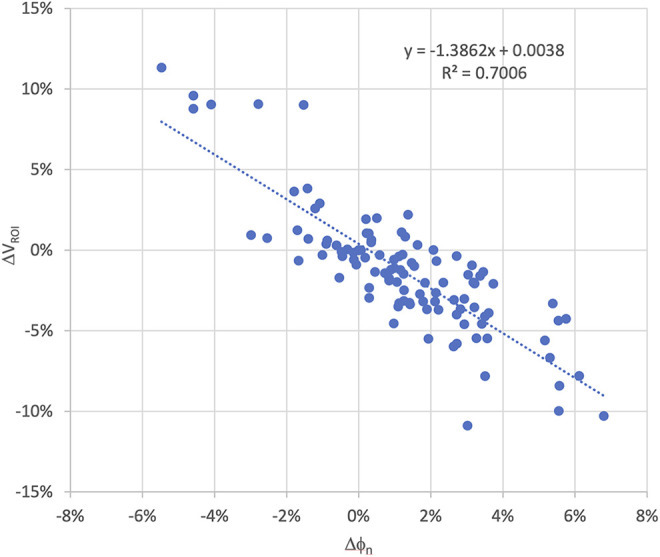
Scatter plot of the transit fluence variation and CBCT volumetric changes of all 24 the patients to assess the correlation between fluence and volume change during the course of treatment.

Scatter plot of the transit fluence variation and CBCT volumetric changes of all 24 the patients to assess the correlation between fluence and volume change during the course of treatment.