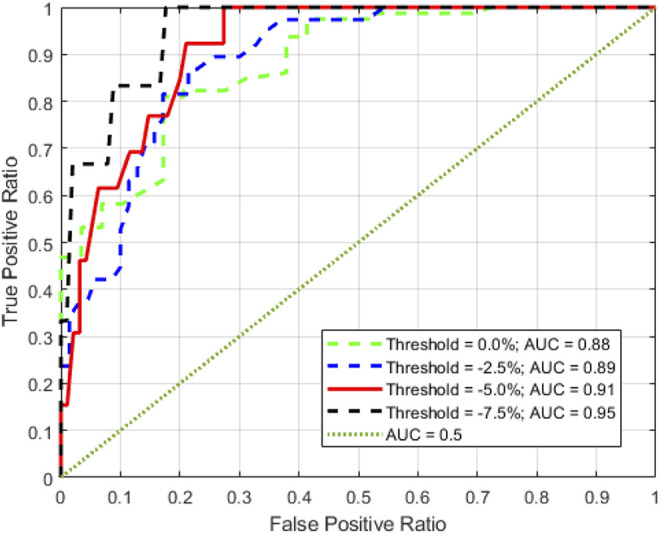
Figure 2.

The solid line represents the ROC curve (AUC = 0.91) of Δϕn using 24 patients and −5.0% volumetric change. The green, blue and black dashed lines represent the volumetric change threshold of 0.0%, −2.5% and −7.5%, respectively; the dotted line represents the reference ROC curve with AUC of 0.50.
