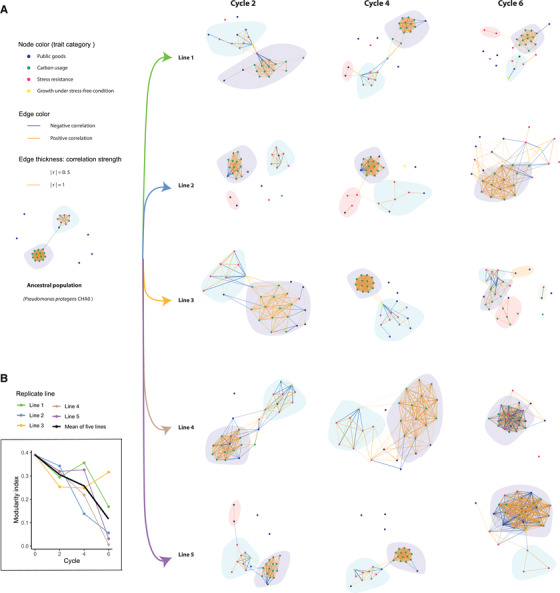
Figure 3.

Evolutionary dynamics of the topology of Pseudomonas protegens CHA0 trait correlation networks in the rhizosphere of gnotobiotic Arabidopsis thaliana Col‐0. (A) Networks of ancestral population and evolved populations at end of each cycle (each network was based upon the phenotypic data of 16 random isolates). Each node represents one of the 28 measured phenotypic traits. Node colors represent a trait's functional category. The two colors of the edge represent positive and negative correlations, respectively. Edges are weighted according to correlation strength, the absolute values of correlation coefficient “r.” Only significant correlations at 0.05 alpha level are included. The P‐values were adjusted with Benjamini‐Hochberg (BH) procedure. Distinct modules are indicated with light background colors. (B) Modularity index. The different replicate evolutionary lines are indicated by lines of different colors; the black line shows the average modularity across all replicate lines. Cycle numbers represent the number of plant growth cycles, with bacteria being transferred to a new plant at the end of each growth cycle.
