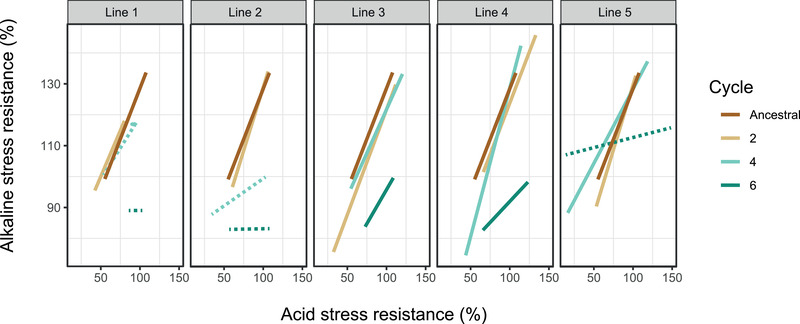
Figure 5.

Evolutionary change of bacterial acid and alkaline stress resistance correlation patterns in the rhizosphere. The x‐axis presents the acid stress (pH 5) resistance capacity, and the y‐axis depicts the alkaline stress (pH 9) resistance capacity. Each block shows the bacterial acidic and alkaline stress resistance correlation patterns of the ancestral and all five replicates population. Different cycles are indicated by different colors, as shown in the legend. Solid lines indicate significant linear relationship, whereas dash lines indicate for no correlation. The linear regression indices are listed in Table S1.
