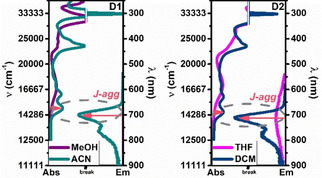
Figure 2.

Absorption and emission spectra of compounds D1 and D2 in good and poor solvents pairs. [D1, D2]: 1.0×10⁻⁵ mol L−1. Highlighted bands were assigned to J aggregates (J‐agg) of D1 and D2. Line breaks were added to magnify visualization of the new absorption bands (at lower wavenumbers) present in poor solvents.
