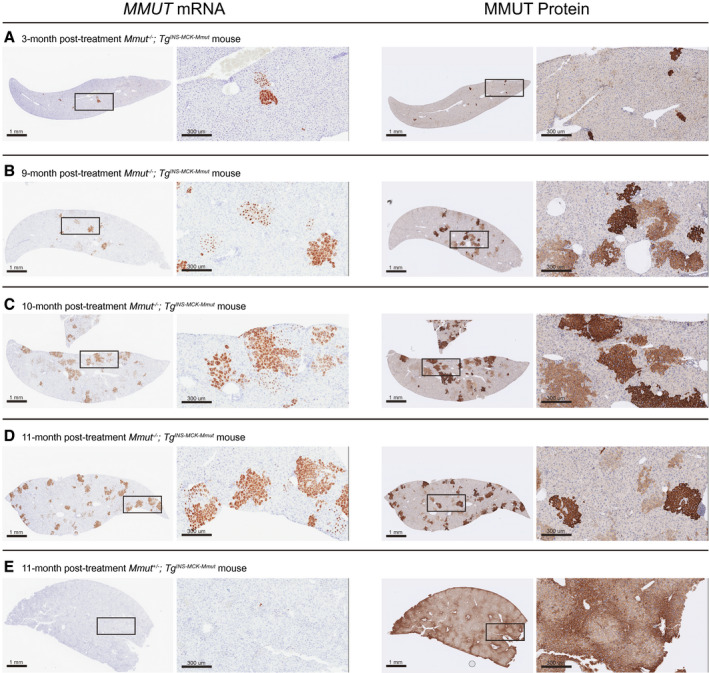
FIG. 6.

MMUT mRNA and MMUT protein expression in livers of treated mice. Representative MMUT RISH and MMUT protein immunohistochemistry staining of serial liver sections in treated mice. Cells positive for mRNA or protein expression are stained brown. The scale bar is 1 mm, and the insert is a 10× magnification. (A) A Mmut–/–;TgINS‐MCK‐Mmut mouse 3 months posttreatment (2.5e11 VG). (B) A Mmut–/–;TgINS‐MCK‐Mmut mouse 9 months posttreatment (2.5e11 VG). (C) A Mmut–/–;TgINS‐MCK‐Mmut mouse 10 months posttreatment (2.5e11 VG). (D) A Mmut–/–;TgINS‐MCK‐Mmut mouse 11 months posttreatment (2.5e12 VG). (E) A Mmut+/–;TgINS‐MCK‐Mmut (WT phenotype, 2.5e12 VG) mouse 11 months posttreatment.
