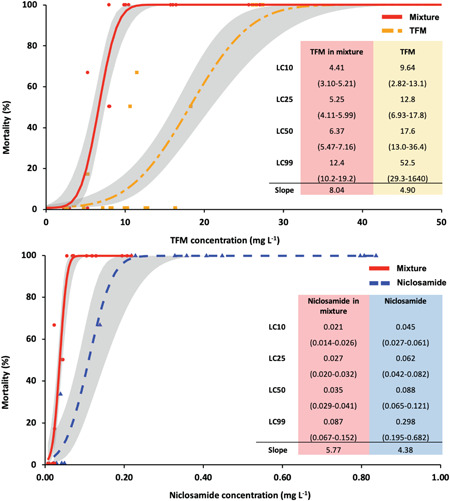
Figure 3.

Dose–response curves for the acute toxicity experiments. Dose–response relationship for juvenile rainbow trout (Oncorhynchus mykiss) exposed to lampricides alone and in combination. (A) Dose response for 3‐trifluoromethyl‐4‐nitrophenol (TFM), either alone (orange) or in the presence of 1% niclosamide (Nic; red). (B) Dose response for Nic, either alone (blue) or in the presence of 100% TFM (red). n = 6 fish/tank, in triplicate, for each exposure concentration. Concentrations of TFM and Nic are plotted against percentage of survival. Insets denote the lethal concentration values calculated for each condition, along with the slopes of the dose–response curves.
