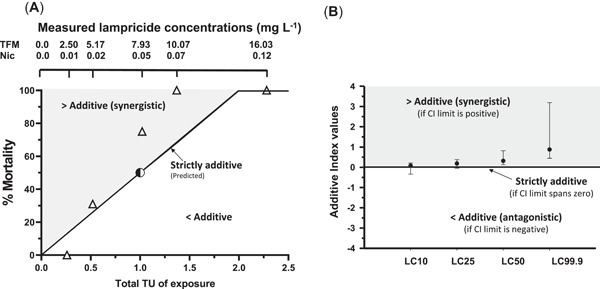
Figure 5.

Interactions between 3‐trifluoromethyl‐4‐nitrophenol (TFM) and niclosamide (Nic) using the toxic unit (TU) and additive index approaches. (A) Plot displaying predicted percentage mortality (line of equivalence) based on strictly additive interactions in rainbow trout (Oncorhynchus mykiss) exposed to increasing concentrations of TFM plus Nic mixtures, expressed as the combined total toxic units of exposure (1 toxic unit = 12‐h median lethal concentration [LC50] of TFM or Nic) of each. Partially shaded circle depicts the expected mortality when the fish were exposed to their respective 12‐h LC50 for TFM or Nic alone, which are equivalent to 1.0 toxic unit. Open triangles denote the observed mortality when the fish were exposed to increasing concentrations of TFM and Nic, expressed as total toxic units of exposure. Note that for each combination of TFM and Nic tested, the greater than additive interactions increased with total toxic unit of exposure. (B) Plot displaying the additive indices calculated from LC values derived from individual and mixture (TFM:Nic, 100:1, w/v) exposures. The shaded area above the lines of strict additivity represents greater than additive (synergistic interactions) between the 2 agents, whereas the open area below the line represents less than additive interactions. CI = confidence interval.
