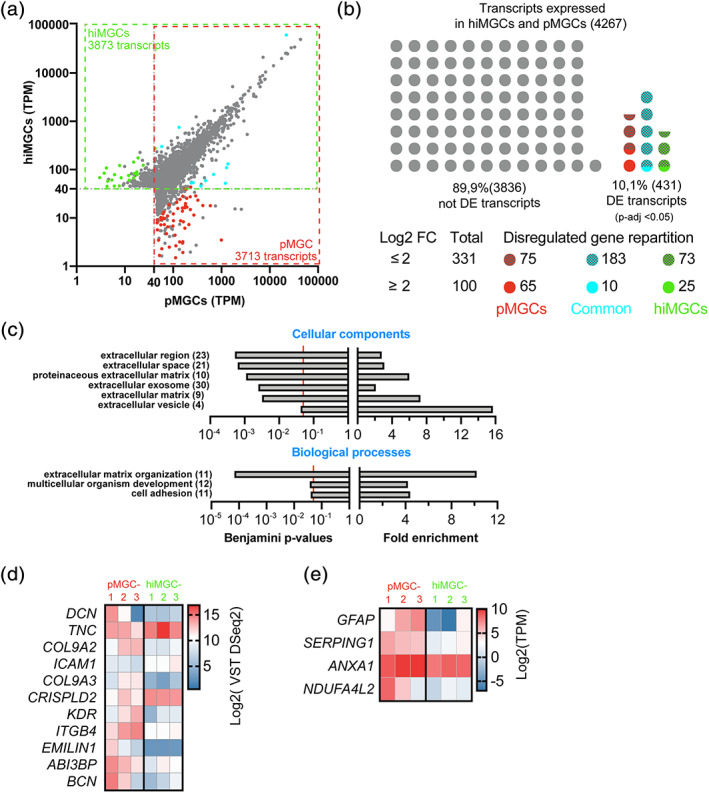
FIGURE 3.

Genes differentially expressed between hiMGCs and pMGCs. (a) Scatter plot of all the transcripts detected in hiMGCs (Y axis) or pMGCs (X axis) with a mean TPM value >40. Grey dots represent genes that were not differentially expressed (DESeq2, p‐value >.05). Colored dots represent genes differentially expressed with a log2 FC ≥2. Green and red dots represent genes only expressed in hiMGCs and pMGCs, respectively. Blue dots represent genes differentially expressed in both groups of cells. (b) Schematic representation of the distribution of the 4,267 genes not differentially expressed (grey dots) or differentially expressed (colored dots) between hiMGCs and pMGCs. Red and hatched red dots represent the 75 and 65 genes differentially expressed (p < .05) found only in pMGCs (Log2 FC ≥2 or <2, respectively). Blue and hatched blue dots represent the 183 and 10 genes differentially expressed (p < .05) found in pMGCs and hiMGCs (log2 FC ≥2 or <2, respectively). Green and hatched green dots represent the 73 and 25 genes differentially expressed (p < .05) found only in hiMGCs (log2 FC ≥2 or <2, respectively). (c) GO enrichment analysis (upper panel, cellular components; lower panel, biological components) of the 100 genes differentially expressed between hiMGCs and pMGCs with a log2 FC ≥2. Left panels represent the Benjamini statistical p‐values for the enrichment test; right panel represents the fold enrichment. Extracellular components were highly represented in the cellular component analysis and the GO term of “extracellular matrix organization” was associated with the highest fold enrichment and the lowest Benjamini p‐values among the biological processes. (Numbers) indicate the total number of transcripts identified for each GO term (d) Heatmap representation of the log2 VST DESeq2 values for the 11 genes differentially expressed involved in the “extracellular matrix organization” in the three pMGCs and the three hiMGCs. (e) Heatmap representation of the log2 TPM expression of four genes differentially expressed found in MGCs from AIR retinas in the three pMGCs and the three hiMGCs. AIR, autoimmune retinitis; hiMGCs, human induced‐pluripotent stem cell‐derived MGCs; pMGCs, primary Müller glial cells; TPM, transcripts per kilobase million; VST, variance stabilizing transformation [Color figure can be viewed at wileyonlinelibrary.com]
