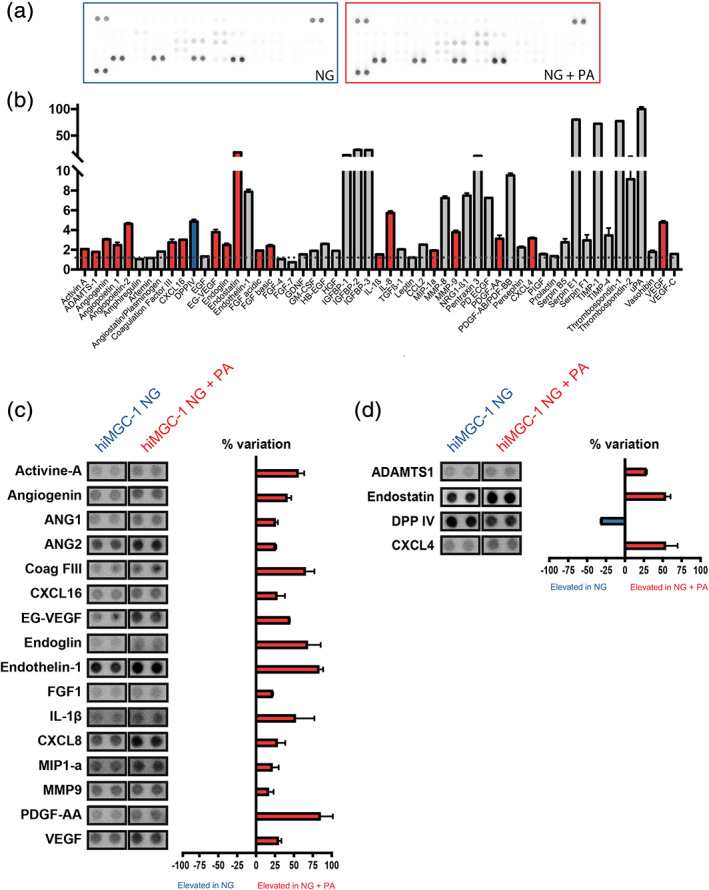
FIGURE 5.

Elevated levels of potent angiogenic factors in the supernatant of hiMGCs treated with palmitate. Semi‐quantitative analysis of the expression level of 55 angiogenic proteins in the supernatant of hiMGCs (hiMGC‐1) treated for 24 hr using an angiogenic blot assay. (a) Representative photography of a blot using the supernatant of hiMGCs treated with NG (left) and NG + PA (right) as a probe. (b) Raw pixel intensity quantification of the 55 proteins found in the supernatant of hiMGCs treated with in NG + PA. Values are expressed in RDU versus membrane background (red bars represent upregulated proteins, blue bars represent downregulated proteins and grey bars represent unregulated proteins compared to the supernatant of hiMGCs cultured with NG). The supernatant of hiMGC‐1 treated for 24 hr with NG + PA contained detectable amounts of 41 angiogenic proteins. (c and d) Graph bar representation of the 20 regulated proteins. Values are expressed in RDU as a percent variation between hiMGCs treated with NG and NG + PA. (c) Regulated pro‐angiogenic proteins (red bars represent the proteins upregulated in the supernatant of hiMGCs treated with NG + PA). (d) Regulated anti‐angiogenic proteins (red bars represent the proteins upregulated in the supernatant of hiMGCs treated with NG + PA, the blue bar represents the protein upregulated in the supernatant of hiMGCs treated with NG). PA regulated 19 angiogenic proteins tested: 16 were proangiogenic and 3 were anti‐angiogenic. Error bars represent the SEM of the duplicate spots, each membrane was incubated with a pool of three independent supernatant. hiMGCs, human iPSC‐derived Müller glial cells; NG, normal glucose concentration (5 mM); PA, palmitate; RDU, relative density units [Color figure can be viewed at wileyonlinelibrary.com]
