
FIGURE 4.
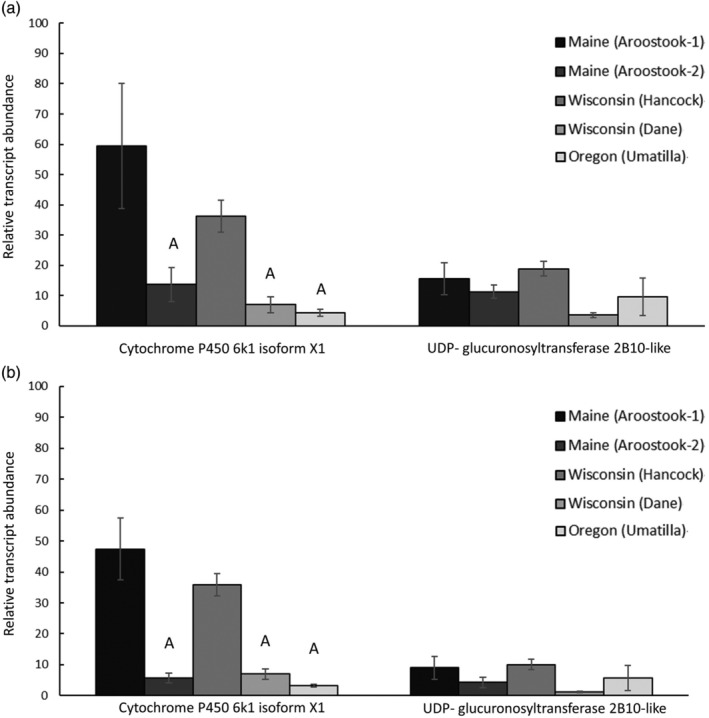
Quantitative polymerase chain reaction (qPCR) validation of targeted RNA sequencing of genes that encode for cytochrome p450 6 k1 isoform x1 and UDP‐glucuronosyltransferase 2B10‐like. (a) RNA sequencing fold change and (b) qPCR fold change. Values represent mean ± SEM and a significant correlation of P < 0.0001 was noted between qPCR and RNA sequencing. Letters are used to denote significance differences for each gene. ‘A’ represents a significant difference (P < 0.05) when compared with Maine (Aroostook‐1) and ‘B’ represents a significant difference (P < 0.05) when compared with Wisconsin (Hancock). Conventionally managed fields include Oregon (Umatilla), Wisconsin (Hancock), Maine (Aroostook‐2), while organically managed fields include Wisconsin (Dane) and Maine (Aroostook‐1).