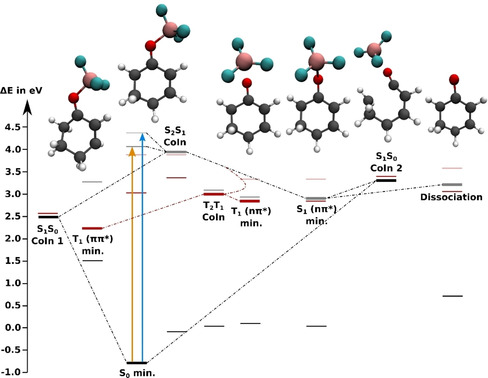
Figure 6.

Energy levels of the adiabatic states of 2 at critical points relevant to the relaxation process evaluated at XMS‐CASPT2(8,7)/cc‐pvdz level of theory. S0 is shown in black, S1 in grey and S2 in faint grey; T1 is shown in red and T2 in faint red. The thick horizontal lines indicate the energies of the optimized states, while the thin lines indicate the energies of all other states at the optimized geometries (see Tables S15–S20). The dotted lines suggest possible relaxation pathways. The molecular structures are (from left to right): The twisted T1(ππ*) minimum (torsion around the C−C double bond), the FC geometry, the T1(nπ*) and S1(ππ*) minima with the torsion around the C−O double bond and the elongated O−B bond, the ring opening CoIn between S1 and S0 and the S1 minimum of free 2‐cyclohexenone (1) that is reached by dissociation in the S1 state.
