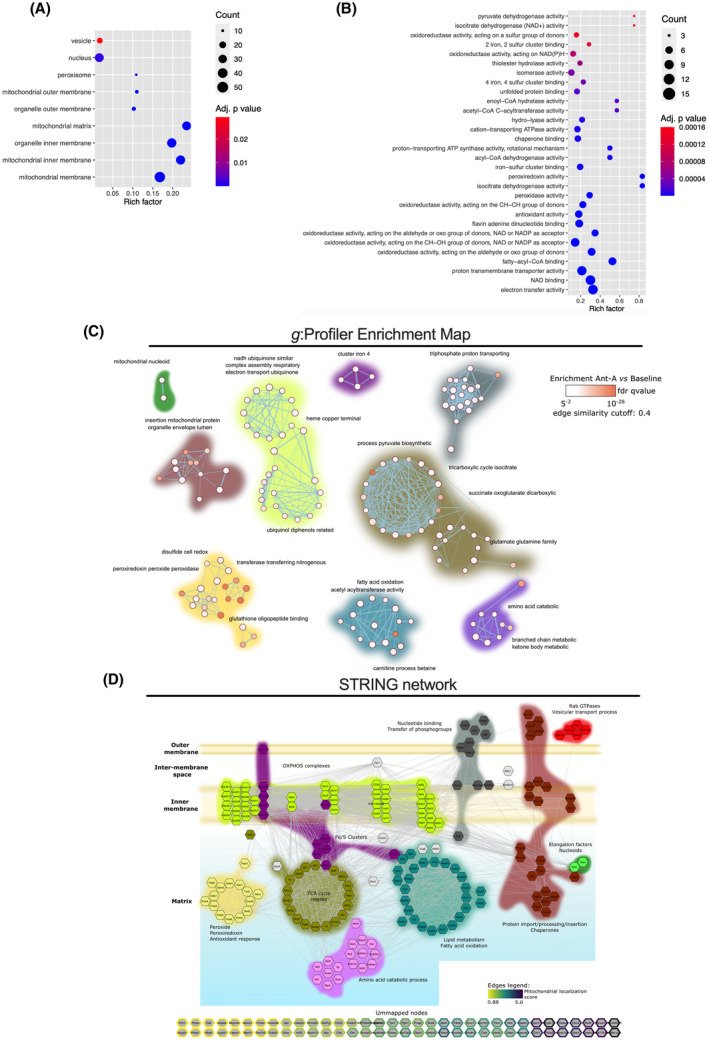
FIGURE 2.

Characterization of the mitochondrial proteins identified in the combined MDV dataset. Functional Enrichment analysis of over‐represented GO cellular component (A) and biological process/molecular function (B) in the combined MDV dataset (baseline and antimycin A) performed using g:Profiler. Proteins with a known predicted mitochondrial localization were included in the analysis. Maximum size of functional categories was set at 90 to filter out large annotations that provide limited interpretative value. 21 The g:SCS algorithm was used for multiple hypothesis testing corrections using a default alpha threshold of 0.05 for significance. Enrichment is expressed as a rich factor, which represents the ratio of the number of proteins observed for a given GO term to the total number of proteins for this term. Circle size reflects the number of proteins per GO term, while color indicates the level of significance. C, g:Profiler enrichment map illustrating the main mitochondrial processes represented in the MDV proteome. Nodes, edges, and node color represent individual GO terms, mutual overlap, and the level of significance of enrichment, respectively. The auto‐annotation tool was used on Cytoscape to automatically generate cluster labels. D, High confidence (interaction score > 0.7 based on default active interaction sources) STRING network of mitochondrial proteins identified in the MDV fractions. GO enrichment data were used to manually cluster proteins based on biological process and location, providing a detailed map of the MDV proteome. The color code used to identify clusters is the same for panels C and D
