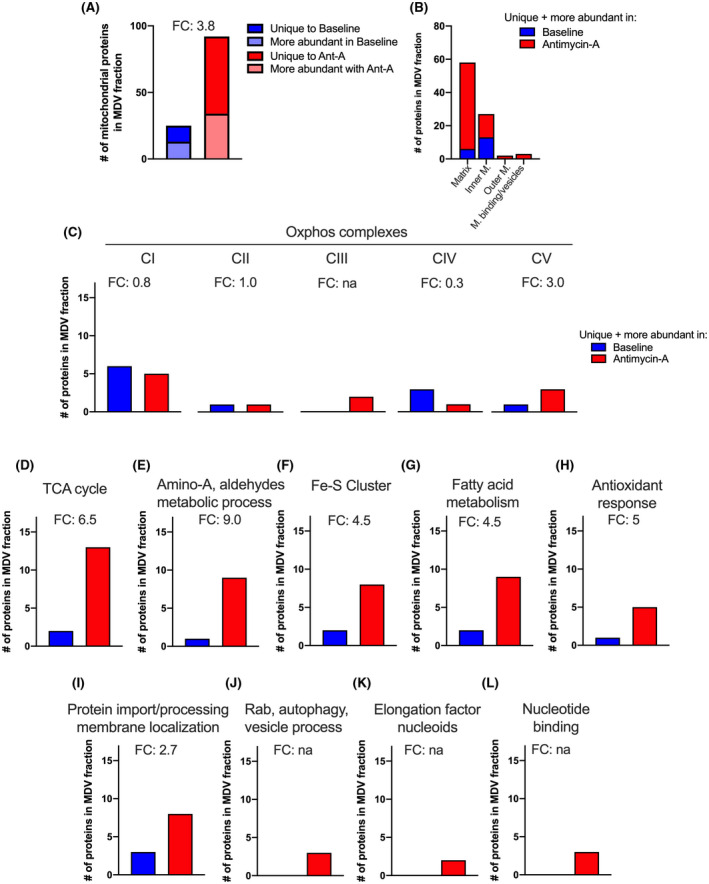
FIGURE 4.

Differential analysis of the MDV proteome at baseline and following exposure to antimycin A. A, Total number of mitochondrial proteins enriched in the MDV fraction in one experimental condition vs the other. This includes proteins that were uniquely detected in one experimental condition and proteins that were significantly (FDR < 15%) more abundant based on LFQ values. B, Submitochondrial localization of mitochondrial proteins detected as unique or more abundant in each of the experimental condition. C‐L, Number of enriched (ie, unique and more abundant) mitochondrial proteins associated with specific mitochondrial processes and molecular functions under baseline and antimycin A conditions. Fold change (FC) is indicated for each process/molecular function
